Server Monitoring with Prometheus and Grafana (2020)
Metrics and email alerting across the Linux and Windows servers at Pelindo III Banjarmasin. [Prometheus, Grafana, Linux].
A server going down is rarely the first event. It is the last one in a sequence nobody was watching.
The server that kept hanging
The CCTV recording server would hang, and the way we found out was that somebody went looking for footage and could not get it. The cause was almost always the same: the recording volume had filled up.
That is the most predictable failure a machine can have. A disk fills at a rate, and the rate is visible for days before it matters. We were still learning about it from a phone call.
So the real question was not how do we monitor servers. It was how do we hear it from the machine instead of from a person.
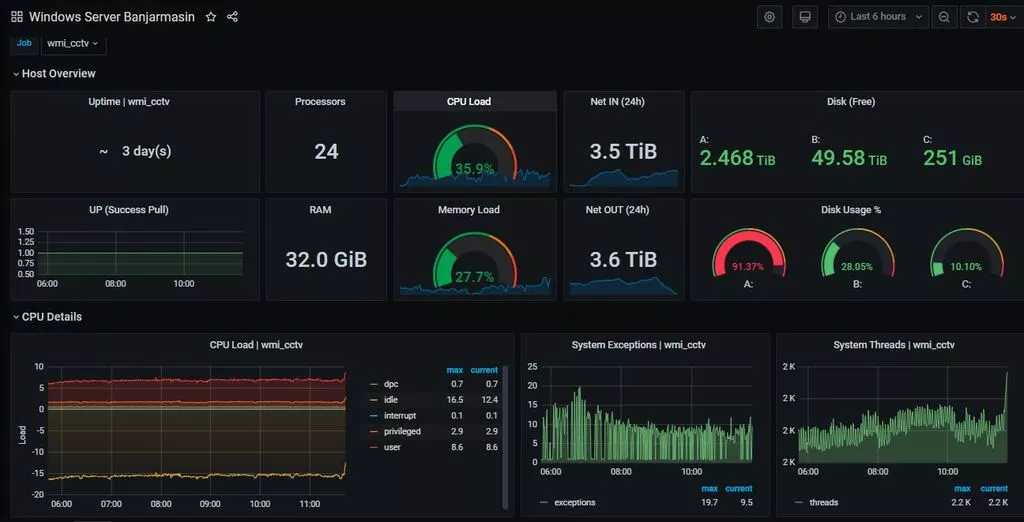
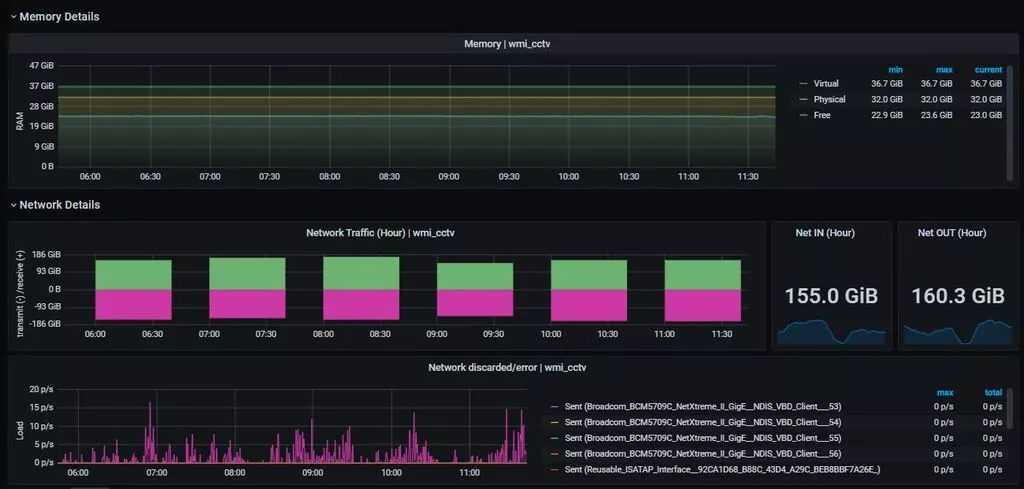
That dashboard is the CCTV server: twenty-four cores, 32 GiB of RAM, and around 155 GiB in and 160 GiB out every hour of camera traffic. Drive A: reads 91.37%, in the red, which is where the last section of this article starts.
Absence of data is data
Prometheus pulls. It scrapes an exporter on each machine on a schedule instead of waiting to be told something, and the panel labelled UP (Success Pull) is the consequence: whether a scrape succeeded is itself a metric, stored on the same timeline as everything else.
A machine that dies stops answering, and that silence is a recorded value you can alert on. With a push-based agent, silence is ambiguous: the agent may have crashed, the network may be down, or nothing at all may be wrong. Pulling is what made IT finds out before the user calls possible in the first place.
Past the exporter, Prometheus does not know which operating system it is talking to. node_exporter on the Linux boxes and wmi_exporter on the Windows ones (the job in the screenshot is named wmi_cctv) both arrive as labelled time series, so one set of dashboards and one set of alert rules covered a mixed estate.
What I would do differently now
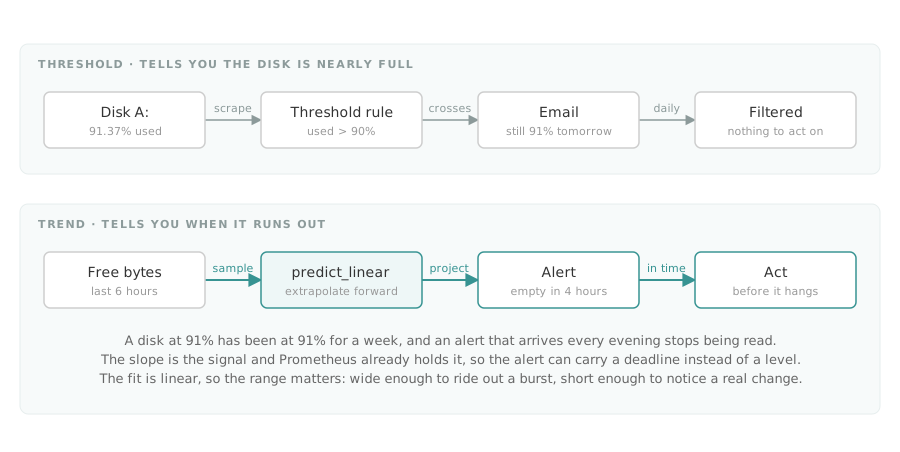
The alerting I built was threshold-based: email when a device stops answering, when a resource crosses 90%, when errors exceed a count. Two of those three are right. The resource one is not, at least not for a disk.
A threshold tells you the disk is nearly full. It does not tell you when it will be full, and those are different questions. Drive A: above is at 91.37% with 2.468 TiB still free. At some fill rates that is a fortnight of headroom, at others it is Thursday afternoon. Worse, a threshold crossed by a filling disk stays crossed. The mail arrives tonight, and tomorrow night, and every night until somebody frees space, so it gets routed to a folder, and then the one that mattered is in the folder too.
Prometheus had the answer built in and I did not know about it. predict_linear() fits a trend across a range and extrapolates it forward:
predict_linear(wmi_logical_disk_free_bytes{volume="A:"}[6h], 4 * 3600) < 0
Read aloud: based on the last six hours, will this volume hit zero inside the next four? That rule stays quiet while a disk sits at 95% and barely moves, and fires at 60% when something starts writing hard. It alerts on the slope rather than the level, which is the sentence at the top of this article written as a query.
Tech stack
- Prometheus: scraping and time-series storage
- Grafana: dashboards
node_exporterandwmi_exporter- Linux, with alerts delivered over email
Where it led
This is the oldest infrastructure entry in the portfolio and the first link in a chain. Prometheus for machines here, then Prometheus and pprof against a Go process at Majoo, then OpenTelemetry tracing across services at eFishery, then RED metrics and Loki at Hukumonline. The same instinct each time, moving one layer closer to the code: a system will tell you what is wrong with it, provided you have given it somewhere to say so.